PerformancePoint Services is a service application that comes equipped with the Enterprise edition of SharePoint Server 2013. It provides flexible tools that enable organisations to create rich Business Intelligence Dashboards to accommodate data from various sources but not limited to Analysis Services (SSAS). Here we are going to look at some of the common content types that Dashboard Designer allows to create and the unique features they exhibit.
Dashboard Designer is a flexible and powerful tool that allows us to tap into the PerformancePoint services in SharePoint 2013. With the help of highly interactive Analytical charts, scorecards embedded with multiple KPIs, and the ability to change chart types on the fly, PerformancePoint services can help an organisation make informed decisions aligned with their objectives.
Dashboard Designer helps create the following types of content:
- KPIs, Indicators and Scorecards – Scorecards can provide a quick glimpse into the key business objectives by providing a mix of KPIs and their trends. The designer allows us to create new KPIs or import existing KPIs from our SSAS cube. The designer also comes with variety of indicators to choose from and we can freely import external indicators.
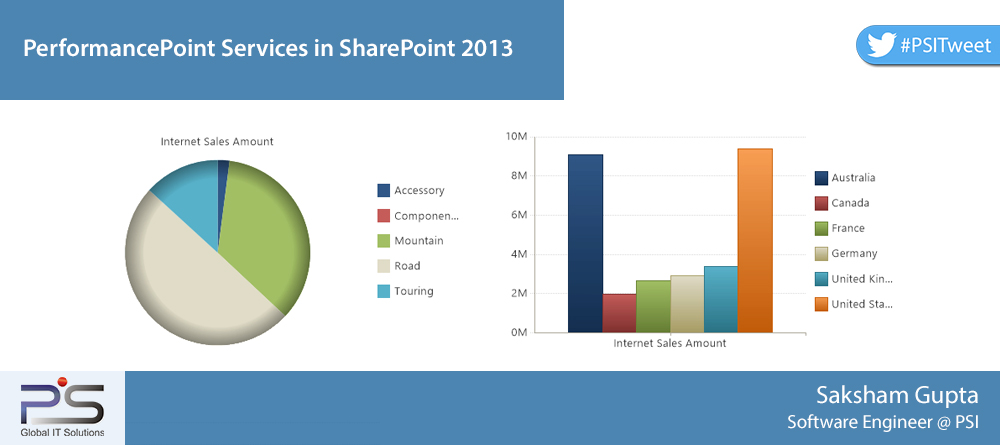
- Analytical charts/grids – They provide the traditional graph types to choose from be it pie, stacked, line charts etc. but the beauty of these is that the types can be modified on the fly even after deployment.
- Filters – Dimension based filters provide an elegant way to filter metrics on our Analytical charts or Grids.
- Dashboard – The pages deployed in SharePoint and containing all the charts, filters, scorecards and KPIs. This is where the filters are tied to their content types.
One of the unique functionalities provided with PerformancePoint services is the ability to use Decomposition Tree and perform root-cause analysis by viewing how individual members in a group contribute to the whole. This is based on any compatible dimension of our choice and with the ability to sort the outcomes on the fly.
It is worth mentioning that Decomposition trees are only available in browsers that support the Silverlight plugin. However Google Chrome doesn’t support it, with version 45 Google Chrome has blocked Netscape Plugin API (NPAPI) plugins from being displayed in the browser. Still there are workarounds present if you want to make them work in versions till 44. Internet Explorer, Firefox and Safari all support Silverlight either natively or through plugin installations.
This is what it looks like:
Drill down/up is also one of the useful functionalities that comes with PerformancePoint services. It allows us to dive into any chart based on one of the available and compatible dimensions. We can also remove one or more members of a chart/graph to concentrate on areas of interest. Apart from this, changing measures on the fly is applicable; just make sure that the involved dimension(s) can support them.
One interesting feature to note is that we can remove member(s) from a chart and focus on the remaining ones. For example – In a chart depicting sales figures for different countries, we can remove the high performing countries and just focus on the low performing ones by drilling down into them based on one or more dimensions to analyse the underlying reasons.
The next question is how we use these services in SharePoint. This requires creating a Business Intelligence Site inside an existing site collection (sub-site) or as separate site collection. Just make sure to enable the PerformancePoint Services Site Collection Features at the site collection level if you decide to go with the sub-site approach.
There is a lot that goes into each of the content types that have been discussed here. A sequel to this article can elaborate on the complex Scorecards that can be built, exploring the various type of filters that come coupled with the charts or the importance of choosing the right axis for dimension and measure while designing a chart or grid.
PerformancePoint Services is a service application that comes equipped with the Enterprise edition of SharePoint Server 2013. It provides flexible tools that enable organisations to create rich Business Intelligence Dashboards to accommodate data from various sources but not limited to Analysis Services (SSAS). Here we are going to look at some of the common content types that Dashboard Designer allows to create and the unique features they exhibit.
Dashboard Designer is a flexible and powerful tool that allows us to tap into the PerformancePoint services in SharePoint 2013. With the help of highly interactive Analytical charts, scorecards embedded with multiple KPIs, and the ability to change chart types on the fly, PerformancePoint services can help an organisation make informed decisions aligned with their objectives.
Dashboard Designer helps create the following types of content:
- KPIs, Indicators and Scorecards – Scorecards can provide a quick glimpse into the key business objectives by providing a mix of KPIs and their trends. The designer allows us to create new KPIs or import existing KPIs from our SSAS cube. The designer also comes with variety of indicators to choose from and we can freely import external indicators.
- Analytical charts/grids – They provide the traditional graph types to choose from be it pie, stacked, line charts etc. but the beauty of these is that the types can be modified on the fly even after deployment.
- Filters – Dimension based filters provide an elegant way to filter metrics on our Analytical charts or Grids.
- Dashboard – The pages deployed in SharePoint and containing all the charts, filters, scorecards and KPIs. This is where the filters are tied to their content types.
One of the unique functionalities provided with PerformancePoint services is the ability to use Decomposition Tree and perform root-cause analysis by viewing how individual members in a group contribute to the whole. This is based on any compatible dimension of our choice and with the ability to sort the outcomes on the fly.
It is worth mentioning that Decomposition trees are only available in browsers that support the Silverlight plugin. However Google Chrome doesn’t support it, with version 45 Google Chrome has blocked Netscape Plugin API (NPAPI) plugins from being displayed in the browser. Still there are workarounds present if you want to make them work in versions till 44. Internet Explorer, Firefox and Safari all support Silverlight either natively or through plugin installations.
This is what it looks like:
Drill down/up is also one of the useful functionalities that comes with PerformancePoint services. It allows us to dive into any chart based on one of the available and compatible dimensions. We can also remove one or more members of a chart/graph to concentrate on areas of interest. Apart from this, changing measures on the fly is applicable; just make sure that the involved dimension(s) can support them.
One interesting feature to note is that we can remove member(s) from a chart and focus on the remaining ones. For example – In a chart depicting sales figures for different countries, we can remove the high performing countries and just focus on the low performing ones by drilling down into them based on one or more dimensions to analyse the underlying reasons.
The next question is how we use these services in SharePoint. This requires creating a Business Intelligence Site inside an existing site collection (sub-site) or as separate site collection. Just make sure to enable the PerformancePoint Services Site Collection Features at the site collection level if you decide to go with the sub-site approach.
There is a lot that goes into each of the content types that have been discussed here. A sequel to this article can elaborate on the complex Scorecards that can be built, exploring the various type of filters that come coupled with the charts or the importance of choosing the right axis for dimension and measure while designing a chart or grid.[:]