Commonly a developer needs a better IDE (Integrated Development Environment) for a language on which he/she is working. JavaScripting is another scripting language and is used widely.
Now, if we look around the web we realize that the IDEs which are really good come with a cost. On the flip side, free one lacks features, whereas, Chrome DevTools is free and also a great IDE.
Least we know about the browser is that we can edit data on the fly, and that reduces the development time.
Hence, the step-by-step tutorial is given to showcase the power of what already is there on the machine.
If you have been searching for a ‘better’ JS IDE, well, Chrome might be something which can stop your search.
Chrome comes with a feature rich JS IDE, DOM debugger, Network and memory profiler. A developer might have used most of the features, one which we rarely use is Chrome as JS IDE!
This all starts from the Dev-Tools window on the browser tab.
Let’s learn by example.
[For the sake of the article, just created a project – WebApplicationForChromeIDEDisplay– A Project could be in any platform/language.]
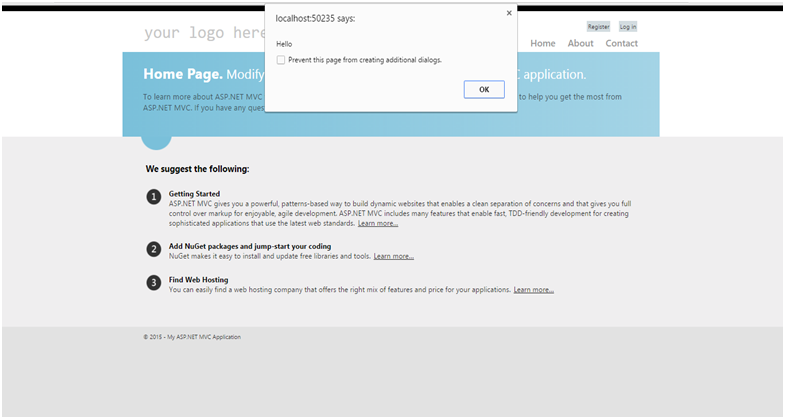
We are displaying a message “Hello”, as an alert when the user hits the url. Now we need to change that message to “Welcome to the website”. Small task! But we are more concerned about HOW then WHAT!
Pre-summarizing what we are about to do, In chrome developer tools we need to “Add a Workspace Folder” and then the browser will sync it with the JS code. This JS code is server with the web request.
First thing we need to do is adding the folder as workspace.
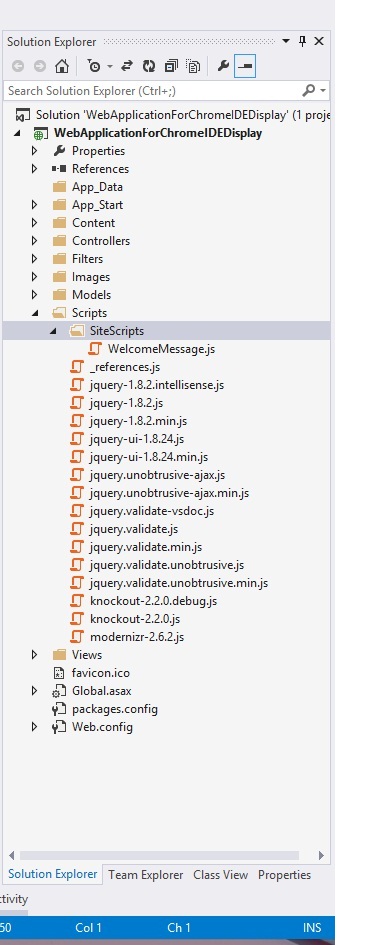 |
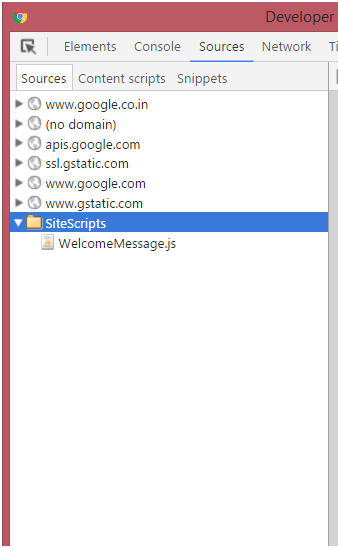
The pic is a slice of screenshot of the Visual Studio IDE, for the project. Looking a bit closely, the file WelcomeMessage.js in SiteScripts is the one which contains the code for welcome message. Most of the web applications follow a similar directory structure the Java scripts are served from one folder on top, it may have subfolders later on. Now we need to add the folder to workspace in the chrome. |
First things first, Adding folder to workspace.
We need developer tools for that. To fire up the developer tools section
Either :
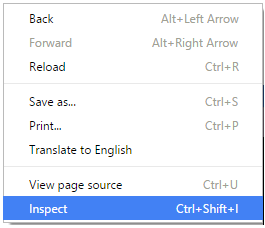
Right click on the client area in browser and from the menu select Inspect
Or :
Press Ctrl+Shift+I.
Alternately, F12 key is your best friend and handy too.
The window that shall appear there after looks a bit like this.
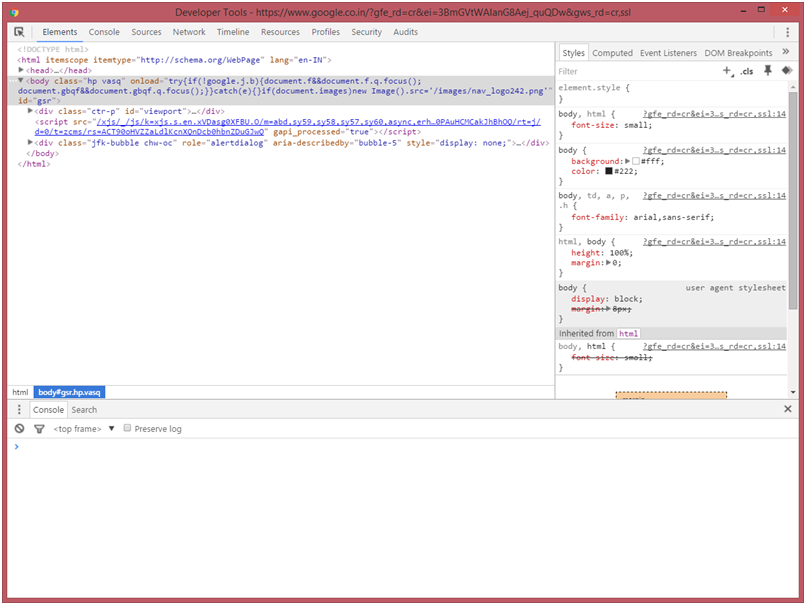
[For convenience the developer window is popped out of the browser window]
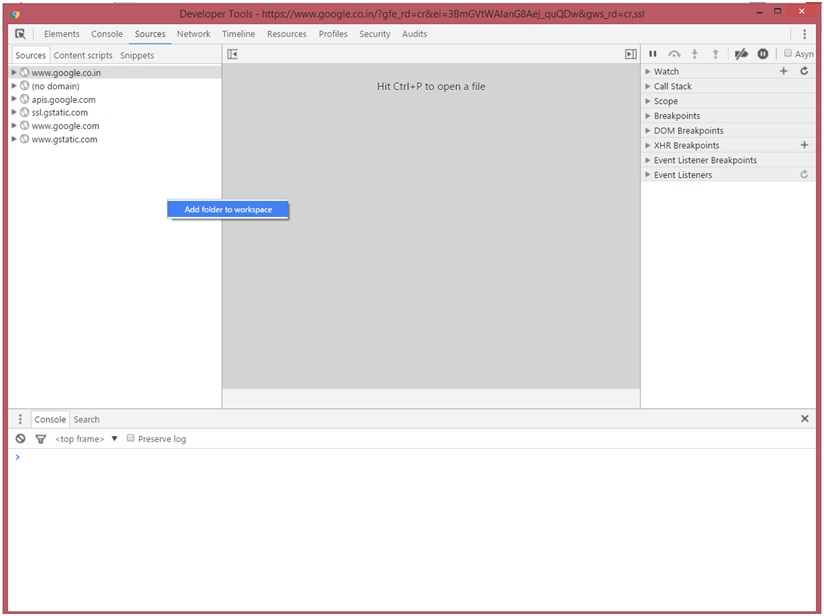
Here select the “Sources” tab, third from the left. And in the “Sources” tab you will find another “Sources” tab. And that “Sources” tab is the place where we will add the folder as workspace.
In the following picture, check that “Sources” in the top bar has been selected [Blue underlined], and the Source tab is selected. Eventually, right clicked the area in Sources tab to explore the sole option “Add folder to workspace”.
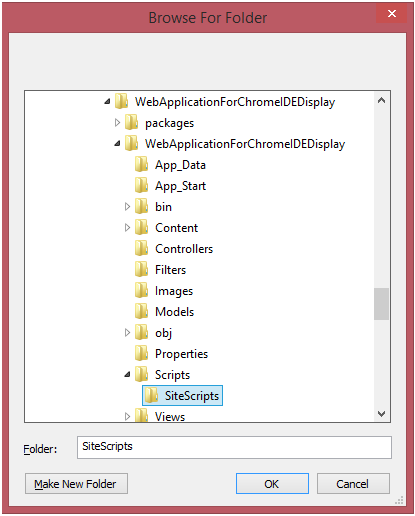
Selecting that will open a “Browse for Folder” dialog box. Select the folder where you are writing your scripts.
In this case it is SiteScripts folder.
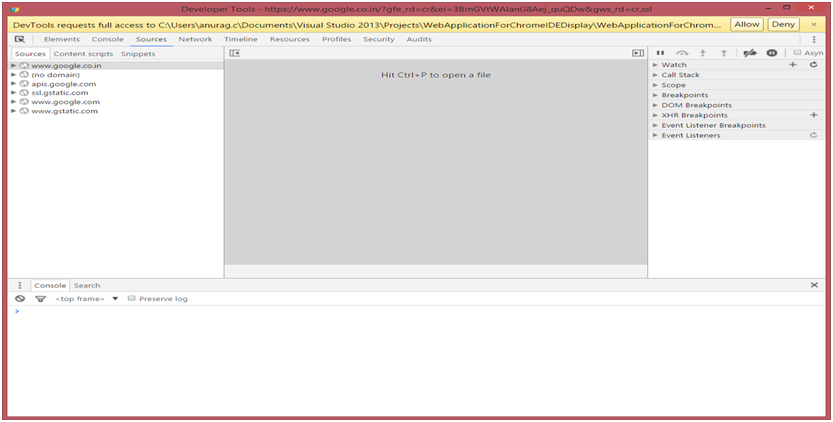
As soon as you hit OK Chrome will ask you to give DevTools access for the specified folder. That is actually where a browser is asking for a file system r/w access.
Hittin “Allow” will make us continue further.
The SiteScripts folder can be seen in the “Workspace”, with the contents. We have just WelcomeMessage.js there.
We are almost there. Be patient!
Now, just host your website. Let the js get served now thru web server, IIS here.
Now the browser will get the same file served from thru webserver, and here chrome will “MAP” those files. Not every time we need to map the files, we just need to map one file from the hierarchy and everything else is done auto-magically.
Back to the problem, lets load the page. And open DevTools.
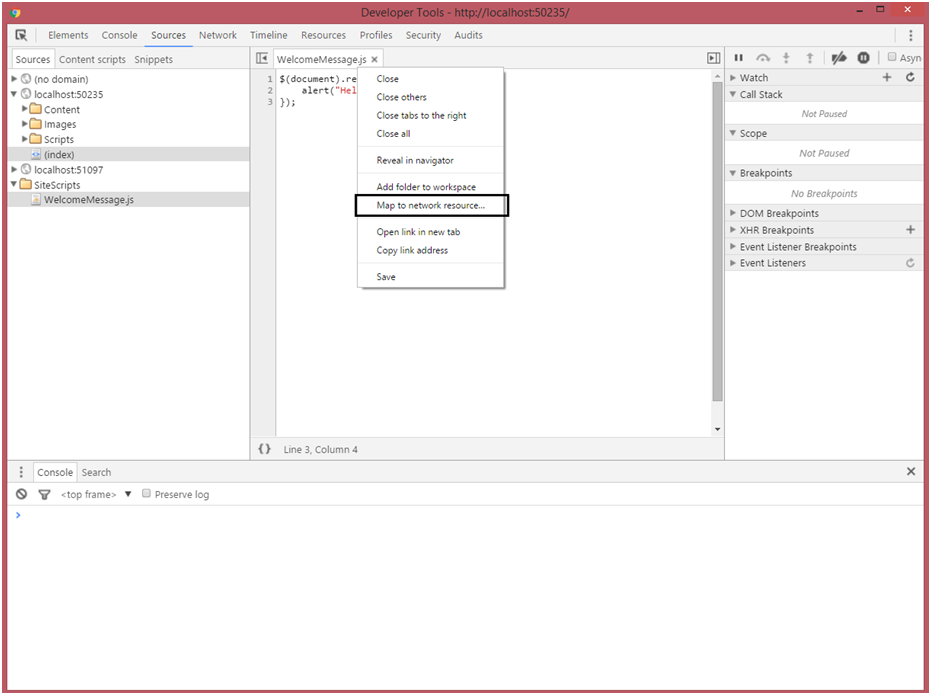
Open the file from Sources tab and right click on the file tab to find the option “Map to network resource…”
Here find a popup which contains the list of all the scripts served from the server, we have just one file and it is showing that there.
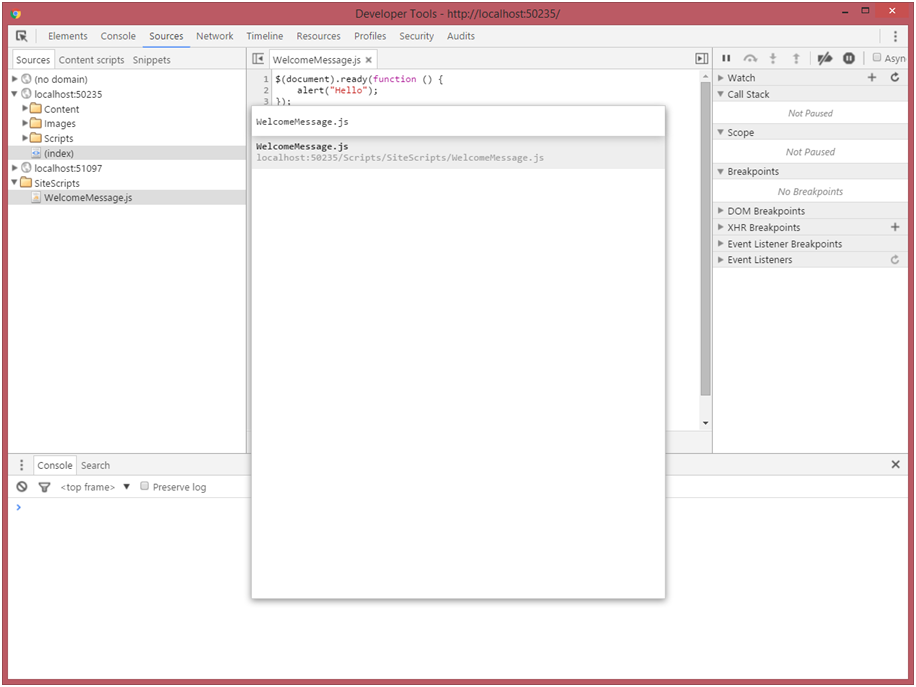
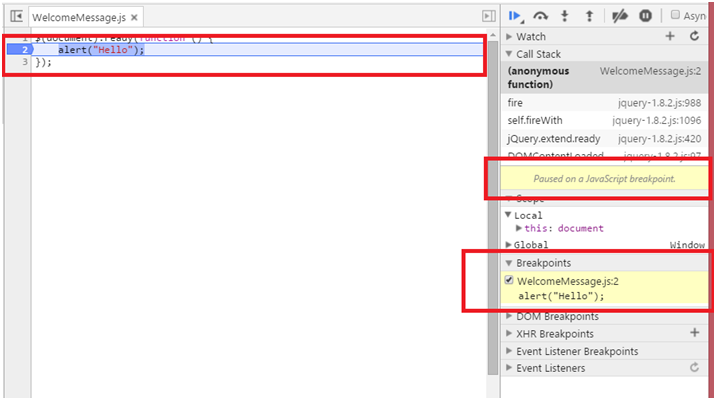
Select that file. And to see if that is working we are creating a break point there. To create a breakpoint just click somewhere near the line number on the bar.
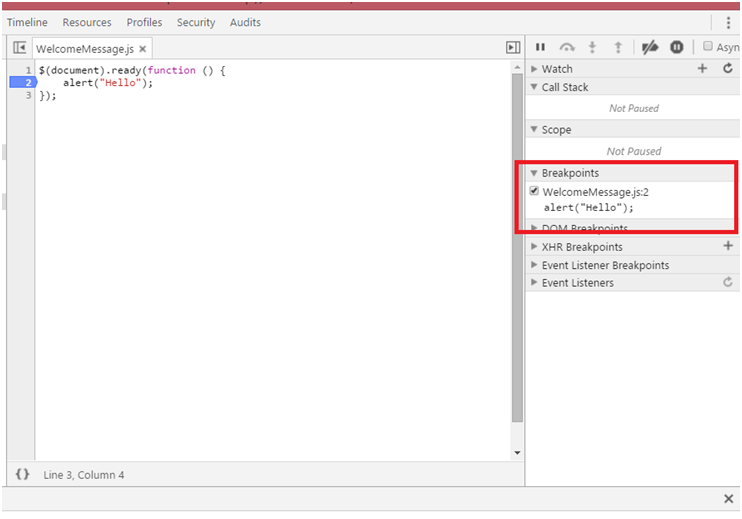
Note that the breakpoints section on right has a new entry, in the format of FILENAME:<LINE_NUMBER> and the text of that line written below for a quick reference. On the code window a blue arrow bar is depicting the breakpoint.
Now reloading the page will make the break point hit.
We can notice highlighting of some of the important parts of the IDE window.
Now, it is the time to fly. We will change the text On-The-Fly, and the browser will respond it instantly.
Let the breakpoint be there. Change the text now to “Welcome to the website”, in the alert call.
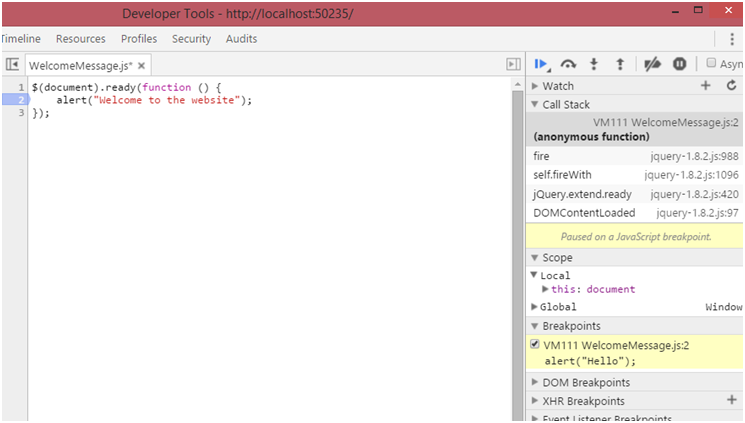
While changing the code the file in the tab will change its name and will append ‘*’ to let the user know that something has changed in the file.
After changing the text as soon as Ctrl+S is triggered, the breakpoint will occur at the same point where it was previously.
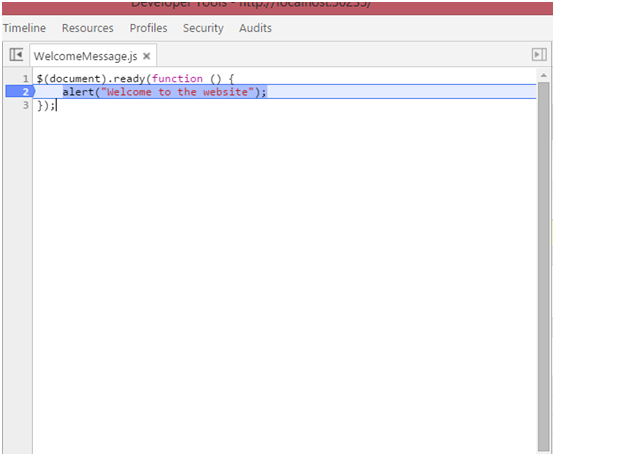
We are done with code changes, just hit the continue button.
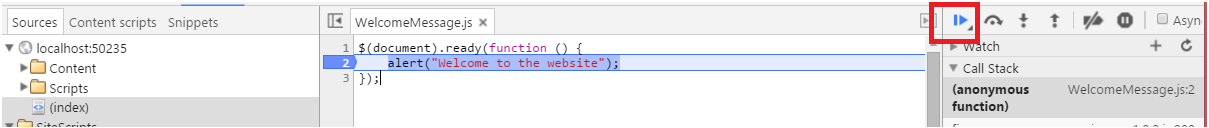
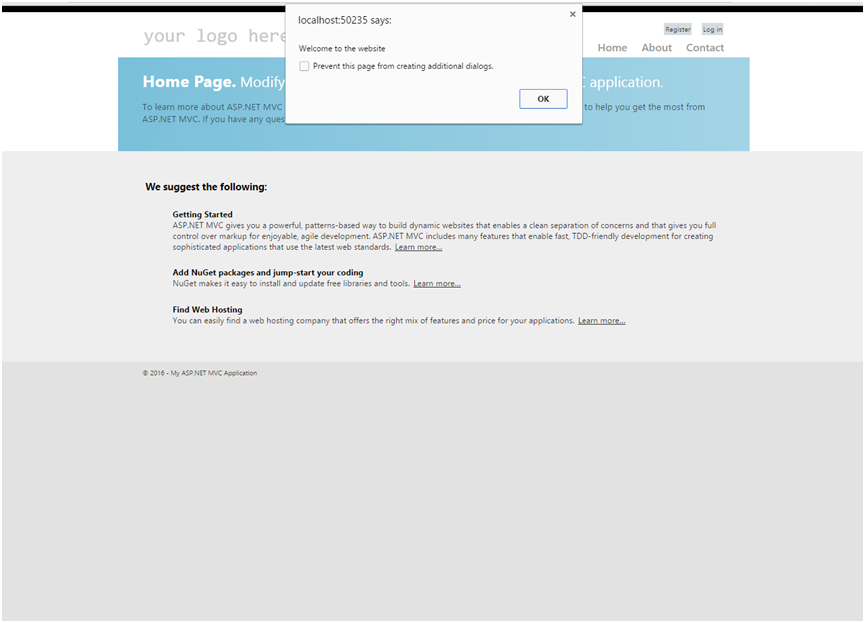
And you will see that we have changed the message, and that too on the fly.
Though the mission is accomplished, but still, possibilities are endless!Commonly a developer needs a better IDE (Integrated Development Environment) for a language on which he/she is working. JavaScripting is another scripting language and is used widely.
Now, if we look around the web we realize that the IDEs which are really good come with a cost. On the flip side, free one lacks features, whereas, Chrome DevTools is free and also a great IDE.
Least we know about the browser is that we can edit data on the fly, and that reduces the development time.
Hence, the step-by-step tutorial is given to showcase the power of what already is there on the machine.
If you have been searching for a ‘better’ JS IDE, well, Chrome might be something which can stop your search.
Chrome comes with a feature rich JS IDE, DOM debugger, Network and memory profiler. A developer might have used most of the features, one which we rarely use is Chrome as JS IDE!
This all starts from the Dev-Tools window on the browser tab.
Let’s learn by example.
[For the sake of the article, just created a project – WebApplicationForChromeIDEDisplay– A Project could be in any platform/language.]
We are displaying a message “Hello”, as an alert when the user hits the url. Now we need to change that message to “Welcome to the website”. Small task! But we are more concerned about HOW then WHAT!
Pre-summarizing what we are about to do, In chrome developer tools we need to “Add a Workspace Folder” and then the browser will sync it with the JS code. This JS code is server with the web request.
First thing we need to do is adding the folder as workspace.
|
The pic is a slice of screenshot of the Visual Studio IDE, for the project. Looking a bit closely, the file WelcomeMessage.js in SiteScripts is the one which contains the code for welcome message. Most of the web applications follow a similar directory structure the Java scripts are served from one folder on top, it may have subfolders later on. Now we need to add the folder to workspace in the chrome. |
First things first, Adding folder to workspace.
We need developer tools for that. To fire up the developer tools section
Either :
Right click on the client area in browser and from the menu select Inspect
Or :
Press Ctrl+Shift+I.
Alternately, F12 key is your best friend and handy too.
The window that shall appear there after looks a bit like this.
[For convenience the developer window is popped out of the browser window]
Here select the “Sources” tab, third from the left. And in the “Sources” tab you will find another “Sources” tab. And that “Sources” tab is the place where we will add the folder as workspace.
In the following picture, check that “Sources” in the top bar has been selected [Blue underlined], and the Source tab is selected. Eventually, right clicked the area in Sources tab to explore the sole option “Add folder to workspace”.
Selecting that will open a “Browse for Folder” dialog box. Select the folder where you are writing your scripts.
In this case it is SiteScripts folder.
As soon as you hit OK Chrome will ask you to give DevTools access for the specified folder. That is actually where a browser is asking for a file system r/w access.
Hittin “Allow” will make us continue further.
The SiteScripts folder can be seen in the “Workspace”, with the contents. We have just WelcomeMessage.js there.
We are almost there. Be patient!
Now, just host your website. Let the js get served now thru web server, IIS here.
Now the browser will get the same file served from thru webserver, and here chrome will “MAP” those files. Not every time we need to map the files, we just need to map one file from the hierarchy and everything else is done auto-magically.
Back to the problem, lets load the page. And open DevTools.
Open the file from Sources tab and right click on the file tab to find the option “Map to network resource…”
Here find a popup which contains the list of all the scripts served from the server, we have just one file and it is showing that there.
Select that file. And to see if that is working we are creating a break point there. To create a breakpoint just click somewhere near the line number on the bar.
Note that the breakpoints section on right has a new entry, in the format of FILENAME:<LINE_NUMBER> and the text of that line written below for a quick reference. On the code window a blue arrow bar is depicting the breakpoint.
Now reloading the page will make the break point hit.
We can notice highlighting of some of the important parts of the IDE window.
Now, it is the time to fly. We will change the text On-The-Fly, and the browser will respond it instantly.
Let the breakpoint be there. Change the text now to “Welcome to the website”, in the alert call.
While changing the code the file in the tab will change its name and will append ‘*’ to let the user know that something has changed in the file.
After changing the text as soon as Ctrl+S is triggered, the breakpoint will occur at the same point where it was previously.
We are done with code changes, just hit the continue button.
And you will see that we have changed the message, and that too on the fly.
Though the mission is accomplished, but still, possibilities are endless![:]